In-situ PL
The In-situ PL panel controls the excitation light source and spectrometer used to monitor photoluminescence during deposition.
A configurable light source, such as a laser or UV LED, illuminates the deposited film while a spectrometer measures the emitted PL signal.
Both the light source and spectrometer probe are mounted on the moving blade-coater assembly. They therefore follow the blade position together, maintaining a consistent measurement geometry across the substrate.
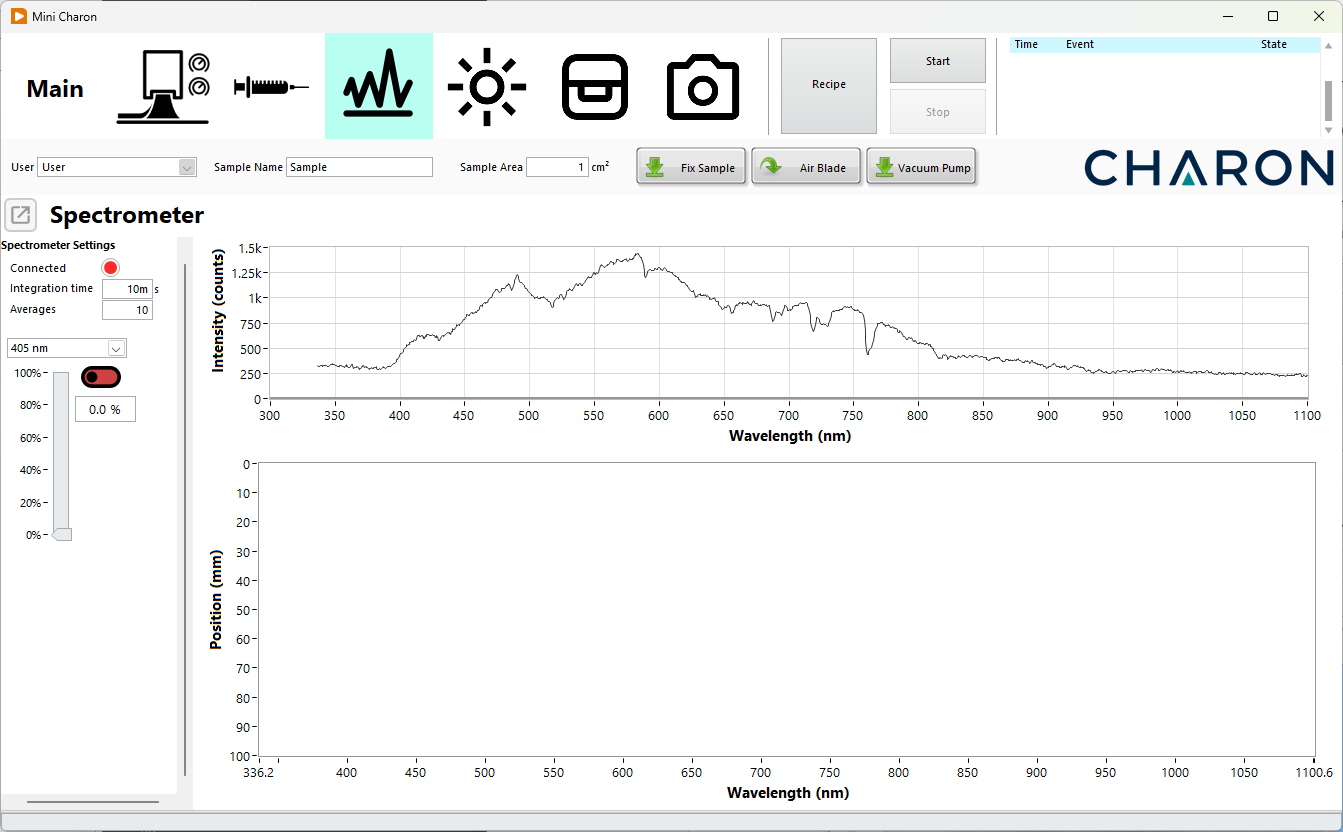
In-situ PL Overview
The panel provides:
- Live spectrum monitoring
- Spectrometer integration-time control
- Spectrum averaging
- Excitation-source selection
- Relative light-intensity control
- Automated PL heatmap acquisition
- Automatic background subtraction
PL heatmaps are acquired through a Charon Recipe.
Typical In-situ PL Measurement
A typical PL measurement procedure is:
- Configure the spectrometer.
- Select the excitation light source.
- Set the required relative light intensity.
- Create a Recipe containing a PL heatmap.
- Configure the measurement positions and acquisition parameters.
- Start the Recipe.
- Charon automatically acquires a background spectrum.
- The excitation source is switched on.
- Spectra are acquired at the configured position intervals.
- Monitor the resulting PL heatmap during the measurement.
Spectrometer Settings
Integration time defines how long the spectrometer collects light for each spectrum. Longer integration times generally provide a stronger measured signal but increase the acquisition time.
Averages defines the number of individual spectra combined to produce one measurement. Increasing the number of averages can reduce measurement noise but also increases the total acquisition time.
The total acquisition time is Integration time * Averages.
Live Spectrum
The upper graph displays the current spectrum as:
- X-axis: Wavelength (nm)
- Y-axis: Intensity (counts)
The spectrometer continuously acquires spectra in the background, allowing the user to verify the PL signal and configure the measurement before starting a Recipe.
Note
The live spectrum displayed outside a Recipe is not saved. Measurement data are saved only when spectra are acquired as part of a Recipe.
Light Control
The light section controls the excitation source used for the PL measurement.
Light Source
Use the source selector to choose the configured excitation source.
Depending on the Charon configuration, this may include different sources or wavelengths, for example:
- UV LED
- Laser
- Different excitation wavelengths
The light intensity is controlled between 0–100%. The percentage represents the relative output level of the source. The light can be switched on or off using the corresponding control.
Info
The light-intensity setting currently represents relative source power and is not a calibrated optical-power value such as mW or mW/cm².
Heatmap Acquisition
The lower graph displays the PL signal measured at different positions along the substrate.
The heatmap axes are:
- X-axis: Wavelength (nm)
- Y-axis: Coater position (mm)
- Color: Normalized PL intensity
During a heatmap measurement, the blade-coater assembly moves across the substrate and a spectrum is acquired at fixed position intervals.
Because the spectrometer probe and excitation source move together with the coater, the measurement geometry remains consistent throughout the scan.
Recipe Configuration
A PL heatmap is configured from the Recipe window.
The user can configure:
- Start and end position
- Position interval
- Spectrometer integration time
- Number of averages
- Excitation light source
- Relative light intensity
For example, if a spectrum interval of 5 mm is selected, Charon acquires one spectrum every 5 mm along the configured movement range.
The acquired spectra are combined to generate the position-dependent PL heatmap.
Background Subtraction
A background spectrum is automatically acquired when a new heatmap measurement is started.
The sequence is:
- The PL heatmap measurement is initialized.
- The excitation light remains off.
- The spectrometer acquires the background spectrum.
- The excitation light is switched on.
- The position-dependent PL measurements begin.
- The stored background spectrum is automatically subtracted from the subsequent spectra.
This removes the spectrometer background and ambient signal from the measured PL spectra.
Note
Background acquisition is automatic. The user does not need to manually acquire or subtract a background spectrum before running the heatmap measurement.
In-situ PL in Recipes
Saved PL measurements are currently performed through a Charon Recipe.
Recipe-based acquisition allows the PL measurement to be synchronized with:
- blade movement,
- substrate temperature,
- liquid deposition,
- drying,
- waiting periods,
- other process steps.
This makes it possible to monitor how the PL spectrum evolves as a function of position during the deposition process.
The creation and configuration of automated processes is described in the Recipes section of this manual.